Use cases by sector

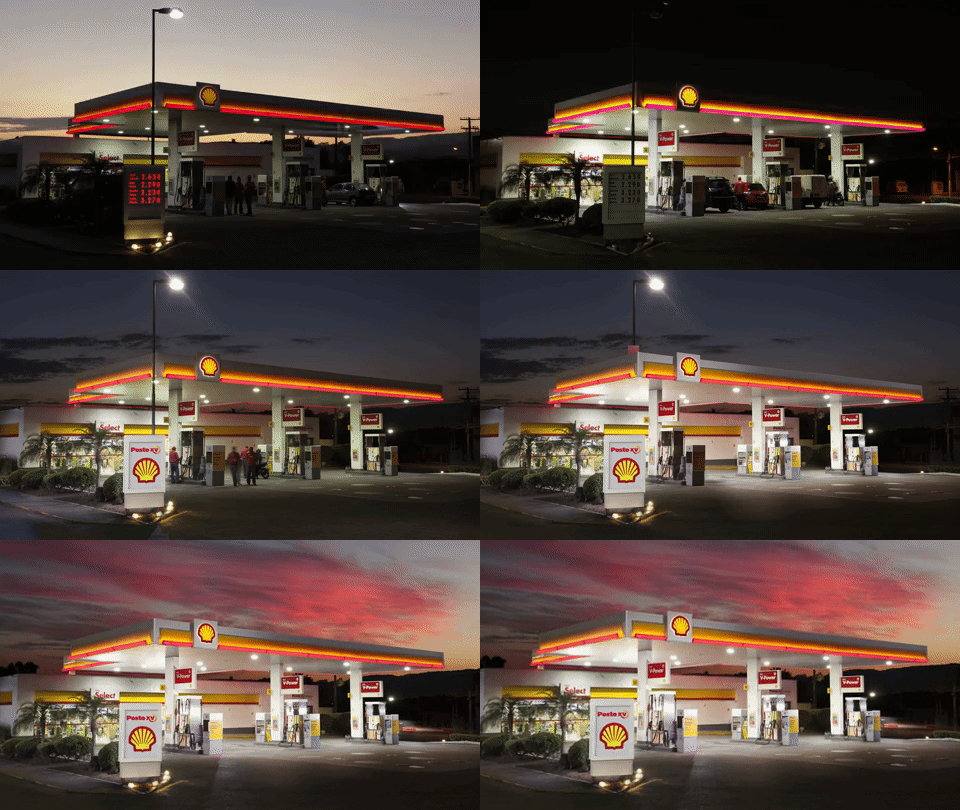
Convenience &
Gas Stations
Get real-time traffic and conversions of each store.
Understand price impact on conversion rates.
Give your managers insights to improve their operation. When and where to act.
Discover shared traffic among stores to improve segmentation.
Optimize work turns based on mobility peaks and conversions results.

Comercial RE & Retail
Get real-time traffic and conversions of each store.
Understand how clients move inside the stores.
Discover the impact of tenant mix on conversion rates.
Detect agglomerations that could represent a security threat.
Understand the geographic origin of your visitors.

OOH
Advertising
Get real-time traffic for each billboard.
Understand who is the audience for each billboard and selected circuits.
Discover hidden migration patterns to maximize exposure.
Use the same metrics as your digital campaigns -reach, frequency, cost per contact - but in the physical world.
Diagnose
Where is the potential?
Measure and rank in real-time the volume of potential customers around your Points of Purchase.
Focus
Where & when to act?
Integrate your sales results to understand conversion rates and growth potential to be captured.
Evaluate
Measure results
Quantify the impact and return on investments of your commercial, marketing and operational actions.

Was mobility something we look deep into it before COVID19?
Each point of purchase has a dynamic potential market, defined by many variables, where mobility is among the most relevant.
We measure mobility in real-time
to understand the profound effect it has on: Sales, Pricing,
Marketing, and Operations.
Reports and Tools
Opportunity map.
Receive automatic weekly reports for each point of sale. Track how much you can grow and when you should focus your actions based on your historical conversion rates performance.
Month performance analysis.
Understand on which days we performed poorly, leaving sales on the street. On average which day of the week offers more growth opportunities.


Hour blocks performance analysis.
Quickly understand on which hours we performed poorly. Focus your actions where continuous bad performing blocks are formed.
Shared traffic between stores.
Create reports based on the mobility of your potential customers. Understand where they come from and how their migration patterns align with your store locations.
Map - shared traffic between stores.
Discover which stores share traffic for any given day to optimize segmentation, promotions and unique campaigns.


Matrix shared traffic between stores.
Visualize shared traffic between stores for longer periods of time. Use this valuable information for strategic decisions such as pricing, segmentation and new locations selection.
Territory mobility evolution.
Track how mobility is changing in the city week by week to diagnose your sales performance. Create reports and export the data to be integrated into your workflow.
City map mobility status
Visualize how mobility is changing through the different zones of the city.

We install our autonomous urban satellites at your points of purchase or OOH billboards.
Each satellite has a sensor capable of measuring mobility in real-time, detecting potential customers' smartphones with an anonymous and GDPR compliant method.
We integrate your sales result to obtain conversion rates in real-time for each point of sale.
Our platform can integrate your sales via CSV/XLS files to analyze your performance and track the impact of your actions on the business.
